In the figure above, illustrates the effect of an increased rate of money supply growth at time period 0. From the figure, one can conclude that the
A) liquidity effect is smaller than the expected inflation effect and interest rates adjust quickly to changes in expected inflation.
B) liquidity effect is larger than the expected inflation effect and interest rates adjust quickly to changes in expected inflation.
C) liquidity effect is larger than the expected inflation effect and interest rates adjust slowly to changes in expected inflation.
D) liquidity effect is smaller than the expected inflation effect and interest rates adjust slowly to changes in expected inflation.
A
You might also like to view...
If currency outstanding equals $500 million, checkable deposits equal $2 billion, reserves equal $200 million, and the required reserve ratio is 0.10, the money multiplier equals
A) 1.14. B) 3.57. C) 4.35. D) 5.
Explain how the purchase of futures contracts can help to insure a farmer against adverse swings in the prices of the crops that he grows
If the price were $25, this firm would _______ in the short run and _______ in the long run.
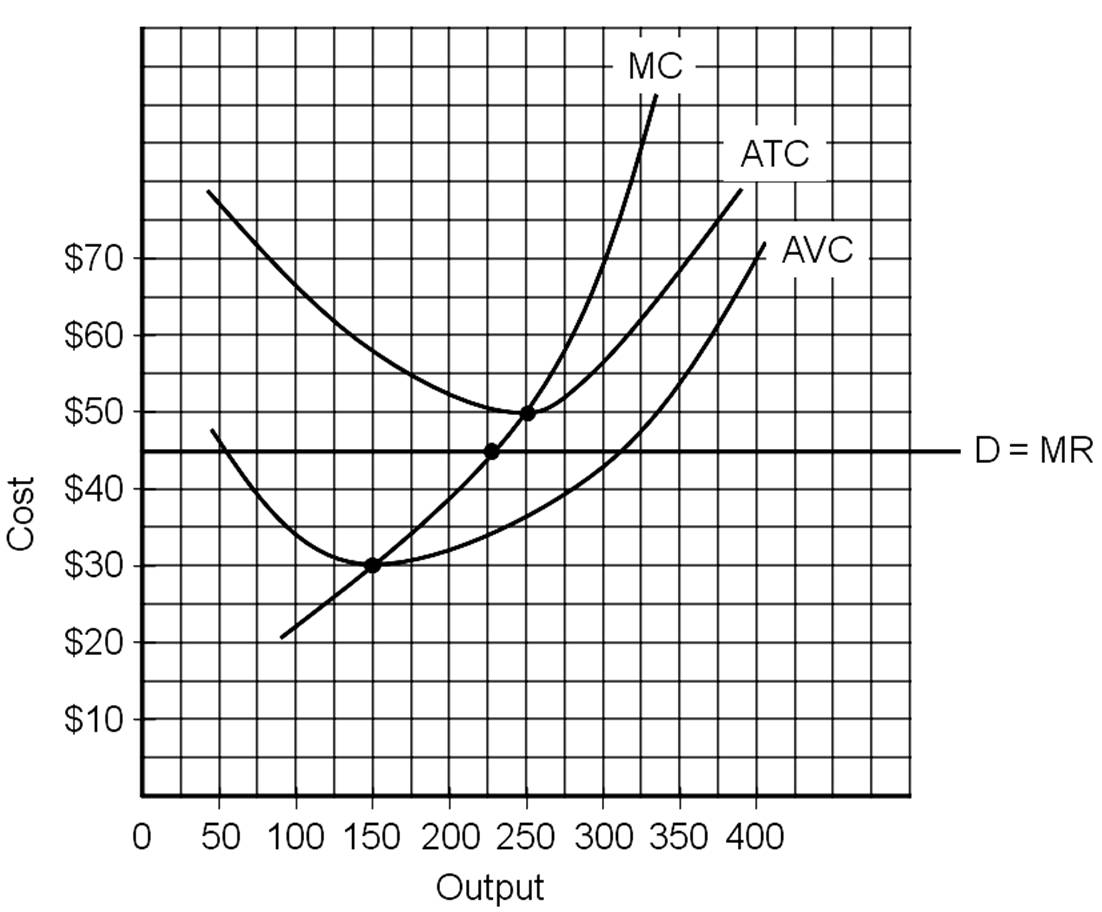
A. shut down; stay in business
B. shut down; go out of business
C. operate; stay in business
D. operate; go out of business
A government-imposed restriction on the quantity of a specific good that another country is allowed to sell in the U.S. is
A) a regional trade bloc. B) an import quota. C) a voluntary import expansion. D) a voluntary restraint agreement.