The bar graph shows the number of new residents in several towns during the years 1999 to 2001. Use the graph to answer the question. 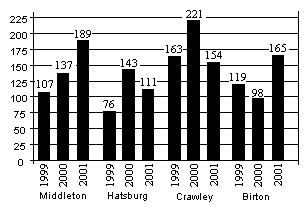 In the year 2000, which town had the smallest number of new residents?
A. Birton
B. Middleton
C. Hatsburg
D. Crawley
Answer: A
Mathematics
You might also like to view...
Provide an appropriate response.Identify whether the slope is positive, negative, zero, or undefined.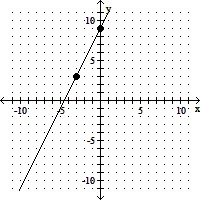
A. Undefined B. Zero C. Negative D. Positive
Mathematics
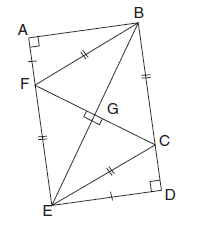
In the following figure,?GBC = 36°. Find the measures of the following angles.
(a) ?GFB
(b) ?BCE
(c) ?CED
Mathematics
If  with A in QIII
?
find
with A in QIII
?
find  .
?
.
?
What will be an ideal response?
Mathematics
Solve the problem.The following table shows the per capita fish consumption, in pounds, in the Virgin Islands in 3 recent years. 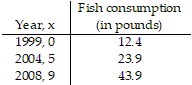 Fit a quadratic function f(x) = ax2 + bx + c to the data. Using this function, what would you predict the per capita fish consumption to be in 2024?
A. 221.4 pounds B. 220.3 pounds C. 217.6 pounds D. 219.9 pounds
Mathematics