The line graph shows the recorded hourly temperatures in degrees Fahrenheit at an airport.  At what time was the temperature the highest?
A. 11 a.m.
B. 1 p.m.
C. 5 p.m.
D. 2 p.m.
Answer: B
You might also like to view...
For the following data table, complete the table of changes, and determine if the data can be modeled exactly by a linear function. Round your answer to two decimal places, if necessary. x 4 5 6 7 y 14.61 17.62 20.63 23.64? Change in x From 4 to 5 From 5 to 6 From 6 to 7 Change in y
What will be an ideal response?
Multiply and simplify. ?
? 
A. 
B. 
C. 
D. 120xy
Provide an appropriate response.Explain how the multiplication and addition principles are used in solving systems of equations using the elimination method.
What will be an ideal response?
Determine whether the graph is that of a function. If it is, use the graph to find its domain and range, the intercepts, if any, and any symmetry with respect to the x-axis, the y-axis, or the origin.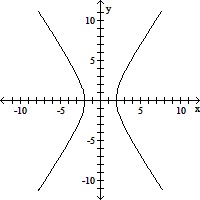
A. function domain: all real numbers range: {y|y ? -2 or y ? 2} intercepts: (-2, 0), (2, 0) symmetry: y-axis B. function domain: {x|x ? -2 or x ? 2} range: all real numbers intercepts: (-2, 0), (2, 0) symmetry: x-axis, y-axis, origin C. function domain: {x|-2 ? x ? 2} range: all real numbers intercepts: (-2, 0), (2, 0) symmetry: x-axis, y-axis D. not a function