First, create a scatter plot for the data in the table. Then, use the shape of the scatter plot given to determine if the data are best modeled by a linear function, an exponential function, a logarithmic function, or a quadratic function.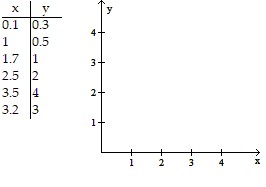
A. 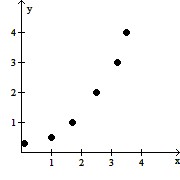
exponential function
B. 
quadratic function
C. 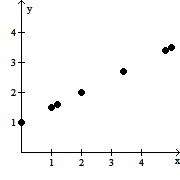
linear function
D. 
logarithmic function
Answer: A
You might also like to view...
Provide an appropriate response.What can you say about the inflection points of the quartic curve  Give reasons for your answer.
What will be an ideal response?
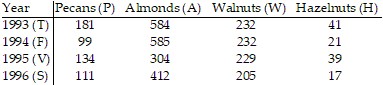
Find the cardinal number of the indicated set by referring to the given table.H ? A,given the following table:
A. 543 B. 1038 C. 2003 D. 625
LetU = {q, r, s, t, u, v, w, x, y, z} A = {q, s, u, w, y} B = {q, s, y, z} C = {v, w, x, y, z}Determine the following. B ? (A - C)
A. {q, s, u, y, z} B. {q, r, s, t, u, v, w, x, y} C. {q, s, u, y} D. {q, s}
Solve the problem.The average cost of a 4-year college education is projected to be $100,000 in 15 years. How much money should be invested now at 3.5%, compounded quarterly, to provide $100,000 in 15 years?
A. $35,153.96 B. $87,749.93 C. $100,000.00 D. $59,290.78