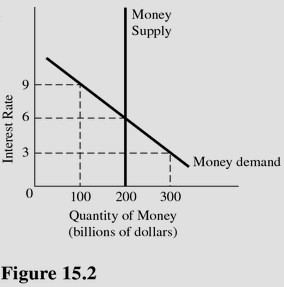
 In Figure 15.2, at an interest rate of 9 percent, there is
A. An excess supply of money of $100 billion.
B. An excess supply of money of $200 billion.
C. Equilibrium in the money market.
D. An excess demand for money of $100 billion.
Answer: A
You might also like to view...
Refer to the above figure. A recession is best described as
A) the upward linear line. B) the period between Point B and Point C. C) the period between Point A and Point B. D) none of the above.
After the terrorist attacks on September 11, 2001, the United States began devoting substantial resources toward the War on Terrorism, homeland security, and relief efforts. As long as our resources were being used efficiently, the production possibilities curve would suggest that:
A. we will have to give up the production of other goods that could have been produced with these resources. B. we will be able to produce the same amount of other goods as before. C. the military spending will result in an outward shift in the production possibilities curve but that the relief effort will result in an offsetting inward shift. D. we will be unable to devote the resources necessary toward these efforts unless there is an improvement in technology.
Refer to the information provided in Figure 31.1 below to answer the question(s) that follow.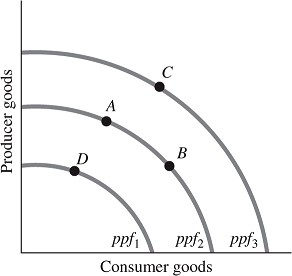 Figure 31.1Refer to Figure 31.1. Economic growth is represented by
A. a movement from point D to point A. B. a movement from point A to point C. C. a movement from point D to point C. D. all of the above
A profit-maximizing firm in the short run will expand output:
A. Until marginal cost begins to rise B. Until total revenue equals total cost C. Until marginal cost equals average variable cost D. As long as marginal revenue is greater than marginal cost