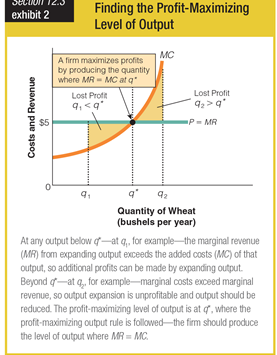
Which of the following examples would cause movement from q* to q2 in this graph?
a. Peak, Inc maintained a steady profit by increasing prices.
b. Peak, Inc reached the perfect maximization of profits.
c. Peak, Inc increased output so much that it began to lose profits.
d. Peak, Inc continued to gain profits as it increased outputs.
c. Peak, Inc increased output so much that it began to lose profits.
You might also like to view...
At the equilibrium rate of interest:
A) the quantity of credit demanded falls short of the quantity of credit supplied. B) the quantity of credit demanded equals the quantity of credit supplied. C) the quantity of credit demanded is zero. D) the quantity of credit supplied is zero.
If the income elasticity of demand for a good is .59, then it is what type of good?
a. Price elastic. b. Price inelastic. c. Income inelastic. d. Income elastic. e. Inferior.
The supply curve for a monopolist is the upsloping portion of the marginal cost curve that lies above the average variable cost curve.
Answer the following statement true (T) or false (F)
The market demand schedule or curve for a product shows the relationship between how much of the product buyers are willing and able to buy and the:
A. Product's price B. Buyers' incomes C. Cost of producing the product D. Time period, say, from one month to the next