Answer the problem.Use the following function and a graphing calculator to answer the questions.f(x) =  + 0.9 sin x, [0, 2?]a). Plot the function over the interval to see its general behavior there. Sketch the graph below.
 b). Find the interior points where f' = 0 (you may need to use the numerical equation solver to approximate a solution). You may wish to plot f' as well. List the points as ordered pairs (x, y).c). Find the interior points where f' does not exist. List the points as ordered pairs (x, y).d). Evaluate the function at the
endpoints and list these points as ordered pairs (x, y).e). Find the function's absolute extreme values on the interval and identify where they occur.
What will be an ideal response?
a).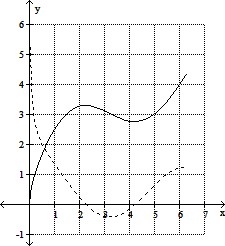
Solid line: f(x); dashed line: f'(x)
b). See figure above. f'(x) = 0 at x = 0.45 and x = 2.7650.
Critical points of f(x) are  and
and  .
.
c). f'(x) is undefined at the endpoint x = 0.
d). Endpoints are (0, 0) and (2?, 3.2984).
e). Absolute minimum: (0, 0); absolute maximum (2?, 3.2984).
You might also like to view...
Solve the problem.Jennifer has $893.24 in her savings account. If she withdraws $69.60, what is the new balance in her account?
A. $962.84 B. $962.24 C. $824.24 D. $823.64
Use the Binomial Theorem to expand the binomial.(x+ 5y)4
A. x4 + 20x3y + 150x2y2 + 20xy3 + 625y4 B. x4 + 5x3y + 150x2y2 + 250xy3 + 625y4 C. x4 + 4x3y + 6x2y2 + 4xy3 + y4 D. x4 + 20x3y + 150x2y2 + 500xy3 + 625y4
Graph the function by starting with the graph of the basic function and then using the techniques of shifting, compressing, stretching, and/or reflecting.f(x) = (x + 7)3 + 2
A. 
B. 
C. 
D. 
Solve the problem.Let p be the percentage of people who are unsatisfied with their current job at t years after 1990. A reasonable model is p = 0.81t + 26.1. In which years will more than 50% of people be unsatisfied with their job?
A. after 2084 B. after 2020 C. after 2030 D. after 2052