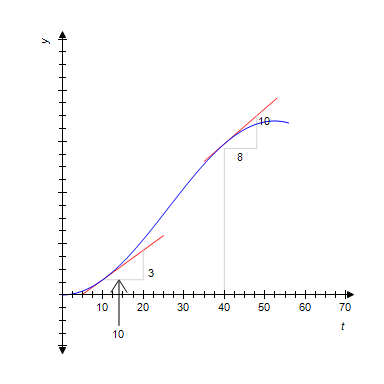
The following graph shows the volume of wood produced in a single-species forest. Here f (t) is measured in cubic meters/hectare and t is measured in years. By computing the slopes of the respective tangent lines, estimate the rate at which the wood grown is changing at the beginning of year 10 and at the beginning of year 40.
?
?
A.  cubic meters/hectare per year in the year 10,
 cubic meters/hectare per year in the year 40
B.
 cubic meters/hectare per year in the year 10,
 cubic meters/hectare per year in the year 40
C.
 cubic meters/hectare per year in the year 10,
 cubic meters/hectare per year in the year 40
D.
 cubic meters/hectare per year in the year 10,
 cubic meters/hectare per year in the year 40
Answer: B
Mathematics
You might also like to view...
Completely factor the difference of two squares.
?
 ?
?
A. 
B. 
C. 
D. 
E. 
Mathematics
Add or subtract measurement numbers, rounding to the correct precision.17 mph + 38.6 mph + 65 mph
A. 120 mph B. 120.5 mph C. 120.6 mph D. 120.7 mph
Mathematics
Match the property with the example of it.Distributive property
A. -2(x + y) = 2x + 2y B. -2(x + y) = 2(-x - y) C. -2(x + y) = -2x - 2y D. -2(x + y) = -2(y + x)
Mathematics
Evaluate the expression.(-4)-2
A. - 
B. -16
C. 
D. 16
Mathematics