What does the normal Q?Q plot show?
Recent research has shown that lecturers are among the most stressed workers. A researcher wanted to know exactly what it was about being a lecturer that created this stress and subsequent burnout. She recruited 75 lecturers and administered several questionnaires that measured: Burnout (high score = burnt out), Perceived Control (high score = low perceived control), Coping Ability (high score = low ability to cope with stress), Stress from Teaching (high score = teaching creates a lot of stress for the person), Stress from Research (high score = research creates a lot of stress for the person), and Stress from Providing Pastoral Care (high score = providing pastoral care creates a lot of stress for the person). The outcome of interest was burnout, and Cooper’s (1988) model of stress indicates that perceived control and coping style are important predictors of this variable.
The remaining predictors were measured to see the unique contribution of different aspects of a lecturer’s work to their burnout. The R output is below and the remaining questions relate to this output.
summary(burnoutModel.1)
Call:
glm(formula = burnout ~ loc + cope, family = binomial(), data = burnoutData)
Deviance Residuals:
Min 1Q Median 3Q Max
-2.9217 -0.5163 -0.3730 0.1273 2.0848
Coefficients:
Estimate Std. Error z value Pr(>|z|)\
loc 0.061080 0.010915 5.596 2.19e-08 ***
cope 0.082714 0.009369 8.829 < 2e-16 ***
---
Signif. codes: 0 ‘***’ 0.001 ‘**’ 0.01 ‘*’ 0.05 ‘.’ 0.1 ‘ ’ 1
(Dispersion parameter for binomial family taken to be 1)
Null deviance: 530.11 on 466 degrees of freedom
Residual deviance: 364.18 on 464 degrees of freedom
AIC: 370.18
Number of Fisher Scoring iterations: 5
logisticPseudoR2s(burnoutModel.1)
Pseudo R^2 for logistic regression
Hosmer and Lemeshow R^2 0.313
Cox and Snell R^2 0.299
Nagelkerke R^2 0.441
exp(burnoutModel.1$coefficients)
(Intercept) loc cope
0.01128261 1.06298389 1.08623164
exp(confint(burnoutModel.1))
2.5 % 97.5 %
(Intercept) 0.005160721 0.02292526
loc 1.041229885 1.08691181
cope 1.067210914 1.10722003
summary(burnoutModel.2)
Call:
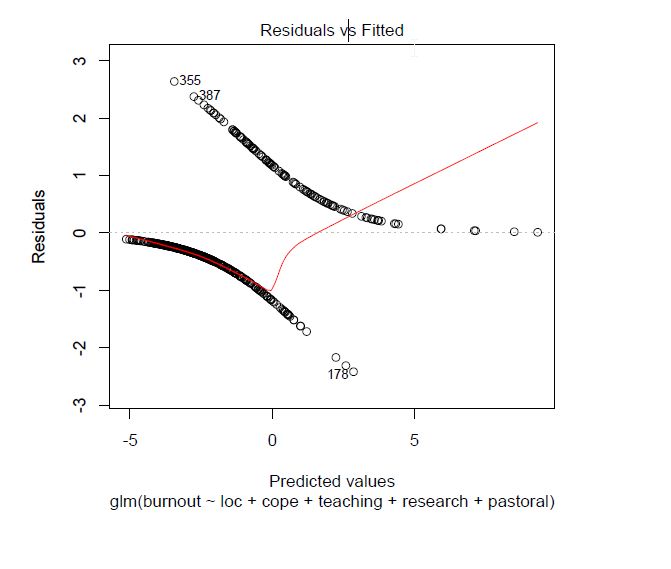
glm(formula = burnout ~ loc + cope + teaching + research + pastoral,
family = binomial(), data = burnoutData)
Deviance Residuals:
Min 1Q Median 3Q Max
-2.41592 -0.48290 -0.28690 0.02966 2.63636
Coefficients:
Estimate Std. Error z value Pr(>|z|)
(Intercept) -4.43993 1.08565 -4.090 4.32e-05 ***
loc 0.11079 0.01494 7.414 1.23e-13 ***
cope 0.14234 0.01639 8.684 < 2e-16 ***
teaching -0.11216 0.01977 -5.673 1.40e-08 ***
research 0.01931 0.01036 1.863 0.062421 .
pastoral 0.04517 0.01310 3.449 0.000563 ***
---
Signif. codes: 0 ‘***’ 0.001 ‘**’ 0.01 ‘*’ 0.05 ‘.’ 0.1 ‘ ’ 1
(Dispersion parameter for binomial family taken to be 1)
Null deviance: 530.11 on 466 degrees of freedom
Residual deviance: 321.20 on 461 degrees of freedom
AIC: 333.2
Number of Fisher Scoring iterations: 6
modelChi; chidf; chisq.prob
[1] 208.9086
[1] 5
[1] 0
logisticPseudoR2s(burnoutModel.2)
Pseudo R^2 for logistic regression
Hosmer and Lemeshow R^2 0.394
Cox and Snell R^2 0.361
Nagelkerke R^2 0.531
exp(burnoutModel.2$coefficients)
(Intercept) loc cope teaching research pastoral
0.01179680 1.11715594 1.15296414 0.89389904 1.01949919 1.04620942
exp(confint(burnoutModel.2))
2.5 % 97.5 %
(Intercept) 0.001317788 0.09419003
loc 1.086274965 1.15212014
cope 1.118430575 1.19286786
teaching 0.858532732 0.92793154
research 0.999115252 1.04068582
pastoral 1.020119629 1.07403586

a. That the data are not normally distributed.
b. Homoscedasticity of errors only.
c. Independence of errors and homoscedasticity.
d. Heteroscedasticity and independence of errors.
a. That the data are not normally distributed.
You might also like to view...
. Robert Owen believed that forcing children to learn and implementing punishment are the best methods of establishing a relationship between the teacher and the learner
Indicate whether this statement is true or false.
A teacher in your school is also an ordained minister, serving a small church in your community on Sundays, and teaching in your school Monday–Friday to supplement his income. Several students and their families attend his church. He also holds a short before school prayer in the teacher's lounge for any teachers that want to join in the prayer. Learning of these events, your new superintendent
fires the teacher for willfully violating the establishment clause. please answer Plaintiff (P) or Defendant (D) according to which of these parties is most likely to prevail (the school is the Defendant (D) in each case):
When constructing a graph, behavior is plotted along the:
a. x axis b. horizontal axis c. vertical axis d. abscissa
The Vineland Adaptive Behavior Scale measures overall cognitive ability
Indicate whether the statement is true or false