Solve the problem.Economists use what is called a Leffer curve to predict the government revenue for tax rates from 0% to 100%. Economists agree that the end points of the curve generate 0 revenue, but disagree on the tax rate that produces the maximum revenue. Suppose an economist produces this rational function 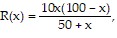 where R is revenue in millions at a tax rate of x percent. Use a graphing calculator to graph the function. What tax rate produces the maximum revenue? What is the maximum revenue?
A. 36.6%; $268 million
B. 35.8%; $276 million
C. 41.2%; $264 million
D. 34.0%; $271 million
Answer: A
You might also like to view...
Write the augmented matrix for the system. Do not solve the system. 6x + 2z = 10 4y + 7z = 26 9x + 3y + 7z = 32
A. 
B. 
C. 
D. 
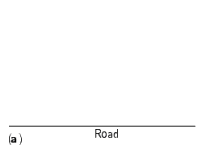
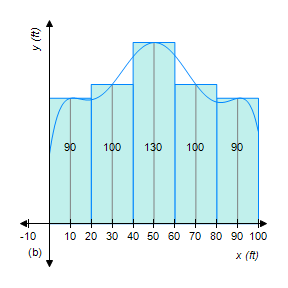
Figure (a) shows a vacant lot with a 100-ft frontage in a development. To estimate its area, we introduce a coordinate system so that the x-axis coincides with the edge of the straight road forming the lower boundary of the property, as shown in Figure (b). Then, thinking of the upper boundary of the property as the graph of a continuous function f over the interval [0, 100], we see that the problem is mathematically equivalent to that of finding the area under the graph of f on [0, 100]. To estimate the area of the lot using a Riemann sum, we divide the interval [0, 100] into five equal subintervals of length 20 ft. Then, using surveyor's equipment, we measure the distance from the midpoint of each of these subintervals to the upper boundary of the property. These measurements give the
values of f(x) at x = 10, 30, 50, 70, and 90. What is the approximate area of the lot?
?
?
?
__________ square feet
Fill in the blank(s) with the appropriate word(s).
Divide. Simplify, if possible.- 2 ÷ 
A. - 
B. - 2
C. - 
D. - 12
Write the interval as an inequality involving x, and illustrate the inequality using the real number line.[-6, 1]![]()
A. -6 ? x < 1![]()
B. -6 < x < 1![]()
C. -6 < x ? 1![]()
D. -6 ? x ? 1![]()