Graph the function f(x) over the given interval. Partition the interval into 4 subintervals of equal length. Then add to your sketch the rectangles associated with the Riemann sum  , using the indicated point in the kth subinterval for ck.f(x) = cos x + 3, [0, 2?], right-hand endpoint
A. 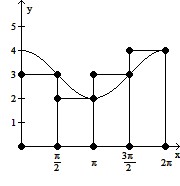
B. 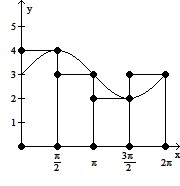
C. 
D. 
Answer: A
You might also like to view...
Find the probability.One card is selected from a deck of cards. Find the probability that the card selected is greater than 2 and less than 7.
A. 
B. 
C. 
D. 
Provide an appropriate response.The table shows the number of pupils per teacher in selected counties in a certain state.  Which counties have a figure greater than 12.5?
A. Dixson, Hendricks B. Addison, Branson, Cumberland, Kendall, Putnum C. Hendricks D. Addison, Branson, Cumberland, Dixson, Kendall, Putnum
The sequence is defined recursively. Write the first four terms.a1 = 2, a2 = 5; an = an-2 - 3an-1
A. a1 = 2, a2 = 5, a3 = 17, a4 = -46 B. a1 = 2, a2 = 5, a3 = 1, a4 = 2 C. a1 = 2, a2 = 5, a3 = -13, a4 = 44 D. a1 = 2, a2 = 5, a3 = -1, a4 = -16
Use the circle graph to answer the question.Last year, one family ate fast food 576 times. The circle graph shows the types of food eaten for the year. Find the number of times fish was eaten.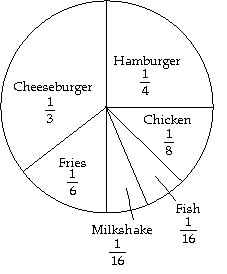
A. 144 times B. 36 times C. 192 times D. 72 times