Based on the graph showing U.S. health care expenditures as a percentage of GDP, the percentage has ______ from 2000 to 2017.
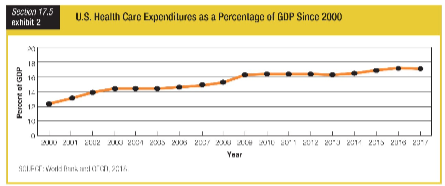
a. risen about 3 percent
b. risen about 10 percent
c. been cut in half
d. remained unchanged
a. risen about 3 percent
You might also like to view...
In the table above, country B is producing 4 units of X and 6 units of Y. For country B, the opportunity cost of producing an additional unit of X is
A) 4 units of Y per unit of X. B) 2 units of Y per unit of X. C) 3/2 units of Y per unit of X. D) 1 unit of Y per unit of X.
The behavior of the M1 velocity of money in recent years can be explained by: a. stability of interest rates
b. a low and stable rate of inflation. c. monetary policy that has been successful in stabilizing the economy. d. financial innovation creating new substitutes for M1 money. e. a large number of banks and savings and loan associations going bankrupt.
The classical model
a. relies on the equivalency of the labor, capital, and land resource markets b. includes a land market and a labor market c. focuses primarily on capital markets d. focuses primarily on labor markets e. focuses on labor, capital, and land markets
You may be unwilling to buy a used car because you suspect the last owner found out the car was a lemon. You may treat a car you rented with a little less care than you would use on your own car
a. Both examples primarily illustrate adverse selection. b. Both examples primarily illustrate moral hazard. c. The first example primarily illustrates adverse selection; the second primarily illustrates moral hazard. d. The first example primarily illustrates moral hazard; the second primarily illustrates adverse selection.