Solve the problem.The bar graph below shows a company's yearly profits from 1991 to 1999. Let an represent the company's profit, in millions, in year n, where n=1 corresponds to 1991, n = 2 corresponds to 1992, and so on. 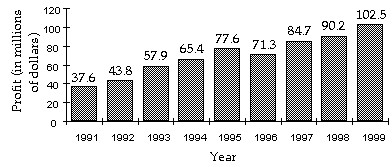 Find
Find 
A. $122.3 million
B. $457.7 million
C. $438.3 million
D. $400.7 million
Answer: C
You might also like to view...
Find the mean for the given sample data. Unless otherwise specified, round your answer to one more decimal place than that used for the observations.Last year, nine employees of an electronics company retired. Their ages at retirement are listed below. Find the mean retirement age.52?67?6352?67?5868?54?54
A. 58.8 B. 58.0 C. 58.2 D. 59.4
Solve.The total profit function P(x) for a company producing x thousand units is given by 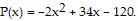 Find the values of x for which the company makes a profit. [Hint: The company makes a profit when
A. x is greater than 5 thousand units B. x is less than 5 thousand units or greater than 12 thousand units C. x is less than 12 thousand units D. x is between 5 thousand units and 12 thousand units
Solve the equation. = 3
= 3
A. {4} B. {8} C. {-8} D. ?
Find the prime factorization of the number. Write the answer with exponents when repeated factors appear.468
A. 23 ? 32 ? 13 B. 34 ? 13 C. 22 ? 32 ? 13 D. 24 ? 13