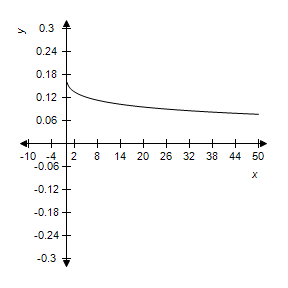
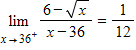
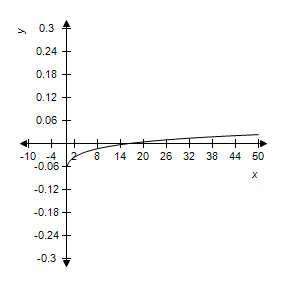
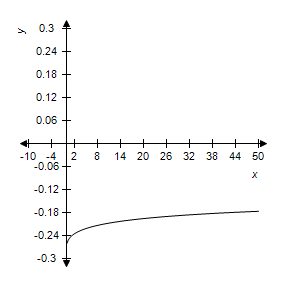
Graphically approximate the limit (if it exists) by using a graphing utility to graph the function.
?

?
A. 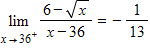
B.
C.
D.

E.
?
?
Answer: D
Mathematics
You might also like to view...
For the given probability density function, over the stated interval, find the requested value.f(x) =  x2, over [-2, 4]; Find the mean.
A. 
B. 
C. 
D. 6
Mathematics
Solve the problem.Find the length of the curve  between x = 0 and x = 3.
A. ?
B.  ?
?
C.  ?
?
D. 2?
Mathematics
Solve the problem.Don runs a charity fruit sale, selling boxes of oranges for $11 and boxes of grapefruit for $10. If he sold a total of 762 boxes and took in $8125 in all, then how many boxes of oranges did he sell?
A. 458 boxes B. 257 boxes C. 505 boxes D. 383 boxes
Mathematics
Use the graph to solve the equation or inequality. If appropriate, write your answer in interval notation.y1 > 3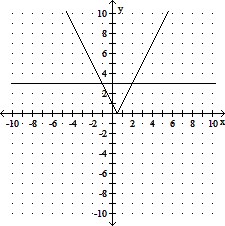
A. [-1, 2] B. (-?, -1) ? (2, ?) C. (-?, -1] ? [2, ?) D. (-1, 2)
Mathematics