Solve the problem.The table shows the percentage of people living below the poverty line in one U.S. city in the years 2000 through 2003. 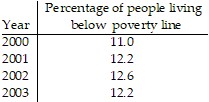 The data in the table can be written as ordered pairs (x, y) where x is the number of years after 2000 and y is the percentage of people living below the poverty line in that year. Use the data for 2000, 2002, and 2003 to find the quadratic function
  that models the percentage, y, of people in this city living below the poverty line x years after 2000. [Hint: Find a, b, and c by substituting each of three ordered pairs into the
function and writing and solving a system of linear equations in three variables.]
A. y = -0.4x2 + 1.6x + 11.0
B. y = -0.5x2 + 1.8x + 11.0
C. y = -0.3x2 + 1.4x + 11.0
D. y = -0.3x2 + 1.3x + 11.0
Answer: A
You might also like to view...
Use the data to complete the table.The following is the number of hours students worked per week at after-school jobs. 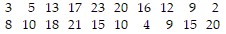
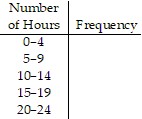
A. Frequency: 3, 3, 5, 5, 4 B. Frequency: 3, 4, 4, 5, 4 C. Frequency: 3, 4, 3, 6, 4 D. Frequency: 3, 4, 4, 4, 5
Find the range of the function.f(x) = 8x2 + 112x + 382
A. (-?, -7] B. [0, ?) C. (-?, 0] D. [-10, ?)
The function graphed is in a window that causes hidden behavior. Experiment with various windows to locate the extrema of the function.y =  x3 -
x3 -  x2 + 4x + 4
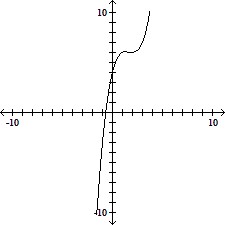
A. Local maximum at (3, 7); local minimum at (1, 6) B. Local maximum at (1.33, 6.07); local minimum at (2, 6) C. Local maximum at (2, 6); local minimum at (1.33, 6.07) D. Local maximum at (0.67, 5.70); local maximum at (3, 7)
Factor.64c3 + 125
A. (4c - 5)(16c2 + 20c + 25) B. (4c + 5)(16c2 - 20c + 25) C. (64c + 5)(c2 - 20c + 25) D. (4c + 5)(16c2 + 25)