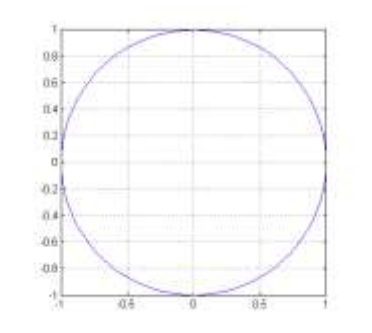
Plotting a circle. The following script plot a circle using 101 points that appears as a circle (not an ellipse) on the plot Find the error in the script.
i = 0:100; % define index array
x = cos(2*pi*i/100); % element-by-element multiplication
y = sin(2*pi*.i/100);
plot(x,y)
axis([-1 1 -1 1]) % axis limits [xmin xmax ymin ymax]
axis square % square axis
grid on % display grid
i = 0:100; % define index array
x = cos(2*pi*i/100); % element-by-element multiplication
y = sin(2*pi*i/100); % <-
plot(x,y)
axis([-1 1 -1 1]) % axis limits [xmin xmax ymin ymax]
axis square % square axis
grid on % display grid
You might also like to view...
While diagnosing the cause of no torque converter clutch engagement on a transmission that seems to shift fine: Technician A suspects a damaged clutch pressure plate into all gears. Technician B suspects a severely worn input clutch. Who is correct?
A. A only C. Both A and B B. B only D. Neither A nor B
Write the equation that defines pOH.
What will be an ideal response?
The most important feed grain for livestock is:
a. rice c. wheat b. barley d. corn
Write a short paragraph explaining how intensive farming and ranching could help and lead to the destruction of natural ecosystems.
What will be an ideal response?