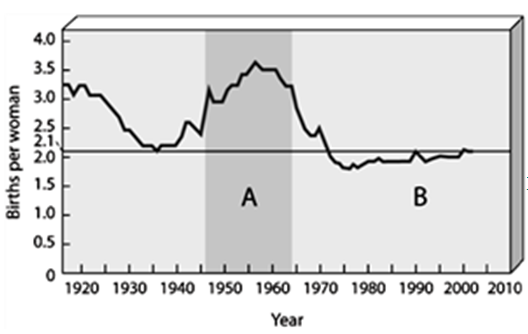
Figure 6.5
?
On the accompanying graph, what does the horizontal line at 2.1 births per women represent? What does the section of the graph marked "A" represent? What does the section of the graph marked "B" represent?
Fill in the blank(s) with the appropriate word(s).
The horizontal line indicates replacement-level fertility. Section "A" represents the baby-boom generation when the average total fertility rate (TFR) was high—3.7. Section "B" shows the TFR decreasing to, or near, replacement level fertility since 1972.
You might also like to view...
Which of the following intermolecular forces best describes why molecules like CF3CF3 are soluble in liquid CO2?
A) dipole-dipole B) induced dipole-induced dipole C) dipole-induced dipole D) ion-dipole E) hydrogen bonding
Attracting talented individuals is important for a city because these individuals are
A) those who make the city famous. B) responsible for promoting economic innovation. C) those who pay taxes. D) those who run for political office. E) responsible for the high-tech jobs created.
The Earth's system that includes the oceans, rivers, lakes, and glaciers of the world is called the ________.
A. geosphere B. atmosphere C. biosphere D. solid Earth E. hydrosphere
The mantle represents 80% of Earth's volume
Indicate whether the statement is true or false