In drawing a supply curve, the labels for the axes are
A. price (on the vertical axis) and quantity (on the horizontal axis).
B. price (on the horizontal axis) and quantity per unit of time (on the vertical axis).
C. price (on the horizontal axis) and quantity (on the vertical axis).
D. price (on the vertical axis) and quantity per unit of time (on the horizontal axis).
Answer: D
You might also like to view...
Car A gets 20 miles per gallon, and sells for $17,000. Car B gets 40 miles per gallon, and sells for $34,000. In the economic way of thinking, which car is more efficient?
A) Car A B) Car B C) Both are equally efficient. D) It depends on the car buyer's estimate of cost and benefit. E) It depends on a number of statistical tests done by economists, the results of which are not stated in the question.
According to the party cycle theory, recessions
a. will be nonexistent in the near future. b. are most apt to occur when a liberal president is elected. c. are most likely to occur during the first couple of years following the election of a conservative president. d. are here to stay.
Missy recently rearranged her portfolio so that it has a higher average return. As a result of this rearranging, Missy
a. raised both firm-specific risk and market risk. b. raised firm-specific risk, but not market risk. c. raised market risk, but not firm-specific risk. d. None of the above is correct.
Figure 11-1
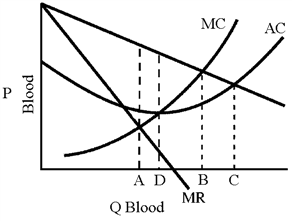
The Red Cross is virtually the only operator of blood banks in the United States. In Figure 11-1 are the demand and supply curves facing the Red Cross blood bank. If it were to operate like a profit-maximizing business, how many units of blood would it sell?
a.
OA
b.
OB
c.
OC
d.
OD