Refer to the graphs below. Pizza and beer are the only two goods Jon consumes. The price of beer is $2.00 per pitcher and pizza is $1.25 per slice. If Jon has only $10 to spend for the evening, which graph represents the set of possible combinations of beer and pizza that he can buy?
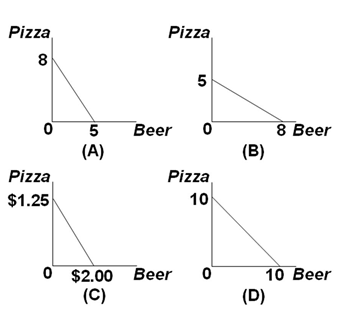
A. Graph A
B. Graph B
C. Graph C
D. Graph D
A. Graph A
You might also like to view...
The widespread decline in the volatility of many macroeconomic variables after 1984 led economists to term this period the
A) Great Moderation. B) Low Volatility Era. C) Steady State. D) Long Boom.
We assume that firms, when they are deciding the best rate of output at which to produce
A) try to get the highest price possible. B) want to maximize sales. C) want to minimize costs. D) want to maximize profits.
It seems self evident that countries would have an advantage in producing those goods that use relatively large amounts of their most abundant factor of production
a. True b. False Indicate whether the statement is true or false
Assume there are two major political parties: the Conservatives and the Liberals. What does the median voter theorem imply about the nature of the platforms (that is, policy stances) of the Conservatives and Liberals?