Solve the problem.The number of traffic accidents has been decreasing in a certain county each year. The data is shown in the table for several recent years. The set of data can be approximated with a linear equation. Calculate the slope of the line. What does it mean in this situation?
A. -140; The number of accidents is decreasing by 140 per year.
B. -70; The number of accidents is decreasing by 70 per year.
C. 80; The number of accidents is increasing by 80 per year.
D. -80; The number of accidents is decreasing by 80 per year.
Answer: B
You might also like to view...
The temperature T of a potato t minutes after being placed in the oven is given by
 .
?
A: Plot the graph of the graph of temperature versus time over the first hour of baking.B: Use the calculator to estimate the value of
.
?
A: Plot the graph of the graph of temperature versus time over the first hour of baking.B: Use the calculator to estimate the value of  after 15 minutes of baking. Round your answer to two decimal places.C: Use the calculator to estimate the value of
  after 30 minutes of baking. Round your answer to two decimal places.D: Explain in practical terms what the answers from parts B and C tell you about how the potato bakes over time.
What will be an ideal response?
after 30 minutes of baking. Round your answer to two decimal places.D: Explain in practical terms what the answers from parts B and C tell you about how the potato bakes over time.
What will be an ideal response?
Identify the interval where f is increasing or decreasing, as indicated. Express your answer in interval notation.f(x) = (x + 1)2 + 1; decreasing
A. [0, 1] B. [-1, ?) C. (-?, -1] D. [-1, 0]
Graph the equation.25x2 - 4y2 = 100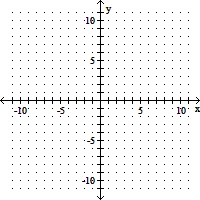
A. 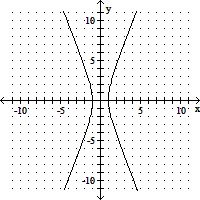
B. 
C. 
D. 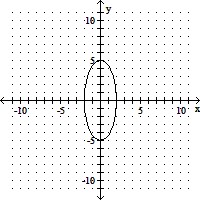
Evaluate. x2 - 2 for x = 3
A. 10
B. 15
C. 13
D. 8