The diagram shows the short-run average total cost curves for five different plant sizes of a firm. If in the long run the firm should produce output 0x, it should do it with a plant of size:
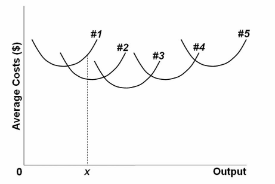
A. #4.
B. #3.
C. #2.
D. #1.
C. #2.
You might also like to view...
Refer to the table below. Busy Betty sells her cakes for $20 each and her constant marginal cost to produce each cake is $12, which is equal to her (constant) average total cost. What is her expected marginal benefit from holding the 20th cake in inventory?
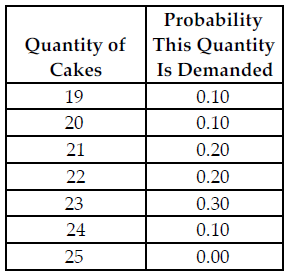
The above table shows the probability distribution of cake sales at Busy Betty's Bakery.
A) $7.80
B) $8.00
C) $7.20
D) $12.80
In a monopoly market,
A. profits will always be positive because the firm is the only supplier in the market. B. other firms have no incentive to enter the market. C. the demand facing the firm is downward-sloping because it is the market demand. D. a and b E. none of the above
"The long-run average cost curve is derived from adding all short-run average cost curves together." Do you agree or disagree? Explain
What will be an ideal response?
Which of the following statements about M1 and M2 is not true?
A. M2 is larger than M1. B. M2 is more liquid than M1. C. Transaction accounts are part of M2. D. Transaction accounts are part of M1.