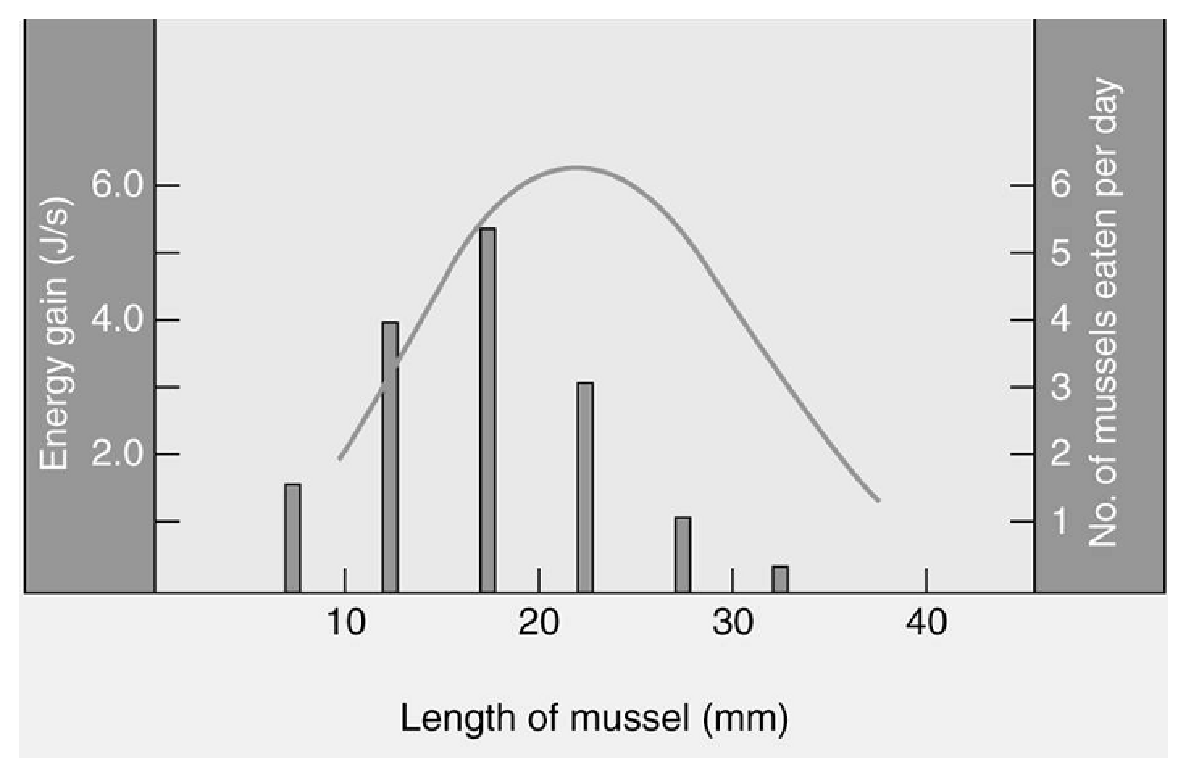
Which of the following is the best interpretation of the graph below of mussel size (x-axis) versus energy gain (line graph, left y-axis), and number of mussels eaten per day (histogram, right y-axis)?
A. Mussels are selected as food sources by crabs.
B. Crabs select mussels in a way that maximizes their energy gain.
C. Mussel size does not seem to be a good predictor as to which mussel hungry crabs will select.
D. Crabs tend to consume most of the largest mussels.
E. Crabs prefer the mussels with the smallest length for their food resources.
Clarify question:
What is the key concept addressed by the question?
What type of thinking is required?
Gather Content:
What do you already know about optimal foraging behaviors? What other information is related to the question?
Choose Answer:
Given what you now know, what information is most likely to produce the correct answer?
Reflection on Process:
Did your problem-solving process lead you to the correct answer? If not, where did the process break down or lead you astray? How can you revise your approach to produce a more desirable result?
B. Crabs select mussels in a way that maximizes their energy gain.
Clarify question:
What is the key concept addressed by the question?
This graph show three sets of data: size of mussels, energy content relative to the size of the mussel, and the number and size of mussels that a crab consumes per day.
What type of thinking is required?
This is an evaluate question. You are being asked to break down the information into individual components and then pick the best interpretation of the data.
Gather Content:
What do you already know about optimal foraging behaviors? What other information is related to the question? This question is linked to the section of the textbook that discusses optimal foraging behaviors. Optimal foraging essentially means getting the most bang for your buck. This data set certainly shows that mussels eat crabs, but which is the BEST interpretation of the graph? Is there a pattern in the size that is selected or are the crabs eating mussels randomly? Do the largest mussels provide the most nutrition to the crab?
Choose Answer:
Given what you now know, what information is most likely to produce the correct answer?
The peak of the histogram and the line graph match pretty well. That shows that the crabs are not just randomly eating mussels, but are preferentially selecting the mussels that provide the highest energy gain. A crab that preferentially eats the most energy rich mussels will have to spend less time eating and will have optimized their foraging.
Reflection on Process:
Did your problem-solving process lead you to the correct answer? If not, where did the process break down or lead you astray? How can you revise your approach to produce a more desirable result?
Were you able to pick the correct answer? You needed to extract the information from the graph, and pick the best interpretation of the data from the choices presented. The concept here is optimal foraging; the crab was trying to get the most reward for the least amount of effort.
You might also like to view...
Nondisjunction in the sex chromosomes is more severe than in the autosomes
A. true B. false
The methylation state of an individual CpG island:
A. is fixed; such genes are permanently turned off. B. is fixed, but this has no effect on whether genes are expressed. C. is randomâ€"sometimes the cytosines are methylated and sometimes they're not, but the state is independent of the environment or cell type. D. can change over time in response to environmental cues, allowing genes to be turned on or off as needed. E. can change over time in response to environmental cues, but this has no effect on gene expression.
How would the cDNA created in a lab compare to the original DNA?
A) It would contain only the genes that were producing proteins in the cell at the time the cDNA was created. B) It would be identical to the original DNA. C) It would be a single strand instead of the original double-stranded DNA. D) It would be circular, similar to bacterial DNA.
Karyotyping
A) shows chromosomes as they appear in metaphase of meiosis II. B) can reveal alterations in chromosome number. C) examines points of crossing over. D) reveals the presence of cancerous genes.