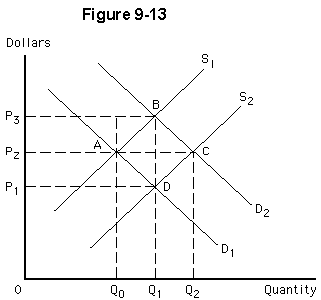
Assume the initial equilibrium is at point D in Figure 9-13. If the market demand curve shifts from D1 to D2, and this results in entry of new firms in the long-run, the new equilibrium in this increasing-cost industry will be
Assume the initial equilibrium is at point D in Figure 9-13. If the market demand curve shifts from D1 to D2, and this results in entry of new firms in the long-run, the new equilibrium in this increasing-cost industry will be
a.
both C and E
b.
both D and E
c.
at a price less than P1
d.
at a price higher than P1
e.
at an output greater than Q1
b
You might also like to view...
The marginal social cost (MSC) function is the sum of the following:
a. market-level marginal abatement cost (MACmkt) + marginal cost of enforcement (MCE) b. marginal abatement cost (MAC) + marginal external cost (MEC) c. marginal abatement cost (MAC) + total social cost (TSC) d. market-level marginal abatement cost (MACmkt) + marginal external cost (MEC)
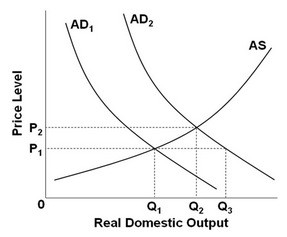 Refer to the above diagram. If AD1 shifts to AD2, then the equilibrium output and price level will be:
A. P1Q3. B. P1Q2. C. P2Q3. D. P2Q2.
When the elasticity coefficient for resource demand is greater than one, resource demand is:
A. inelastic. B. elastic. C. unit-elastic. D. perfectly inelastic.
For each of the following pairs of products, state which are complements, which are substitutes, and which are unrelated
a. Swim fins and scuba tanks b. Coca Cola and Volkswagens c. Printers and ink cartridges d. Ice and ice chests e. Heineken and Corona