Refer to the information provided in Figure 3.2 below to answer the question(s) that follow.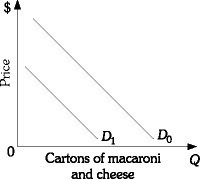 Figure 3.2Refer to Figure 3.2. Which of the following would be most likely to cause the demand for macaroni and cheese to shift from D0 to D1?
A. a decrease in income, assuming macaroni and cheese is a normal good
B. an increase in the price of flour used to make macaroni and cheese
C. a decrease in the price of macaroni and cheese
D. an increase in the quantity demanded for macaroni and cheese
Answer: A
You might also like to view...
If, between 2006 and 2016, the economy's real GDP grew from $20 billion to $40 billion, what was the average annual growth rate in the economy?
A) 3% B) 7% C) 20% D) 100%
Which statement is true?
A. There are at least a dozen different theories of poverty. B. The liberals and conservatives are in basic agreement about the causes of poverty. C. The liberals and conservatives are in basic agreement about how to solve the poverty problem. D. None of these statements are true.
Suppose the economy is at a full-employment GDP of $1 trillion and the tax revenue received by the federal government is always one-fifth of GDP. If planned government expenditure is $300 billion, the structural
A. Deficit is zero. B. Deficit is $100 billion. C. Deficit is $500 billion. D. Surplus is $100 billion.
A risk-averse person has
a. a utility function whose slope gets flatter as wealth rises. This means they have increasing marginal utility of wealth. b. a utility function whose slope gets flatter as wealth rises. This means they have diminishing marginal utility of wealth. c. a utility function whose slope gets steeper as wealth rises. This means they have increasing marginal utility of wealth. d. a utility function whose slope gets steeper as wealth rises. This means they have diminishing utility of wealth.