Use the following figures to answer the next question.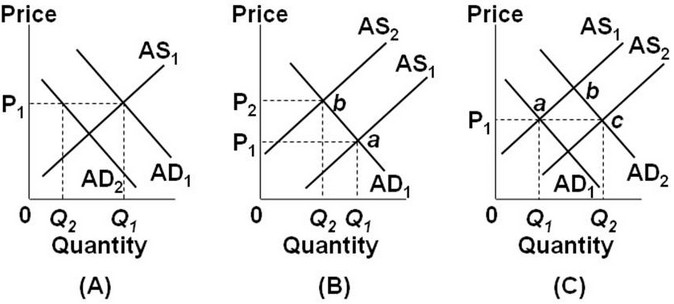 In the diagrams, AD1 and AS1 are the "before" curves. Stagflation is depicted by ________.
A. panel (A) only
B. panel (B) only
C. panel (C) only
D. panels (B) and (C)
Answer: B
You might also like to view...
Exxon Mobil wants to pay 160,000 to a German supplier. They get an exchange rate quotation from its own commercial bank and instructs it to debit their dollar account and pay 160,000 to the supplier's German account
If the exchange rate quoted is $1.2 per euro, how much is debited to Exxon Mobil's account? A) $160,000 B) $172,000 C) $180,000 D) $192,000 E) $150,000
By 1937, when a new recession began in the midst of the Great Depression,
A) GDP had almost recovered to its 1929 level, but unemployment was still above the 1929 level. B) unemployment had almost fallen back to its 1929 level, but GDP had yet to recover to its 1929 level. C) neither GDP nor unemployment had returned to near their 1929 levels. D) both GDP and unemployment had returned to near their 1929 levels.
In the above figure, if the firm is facing demand curve d2, then to maximize profits it will produce at output level
A) A. B) B. C) C. D) D.
Tim deposits $30,000 into Statewide Bank. Statewide has a money multiplier of 8. How much money could Tim’s deposit potentially create?
a. $30,000 b. $240,000 c. $3,750 d. $26,250