The graphs below display the data points for two linear correlations. Which graph displays the negative correlation?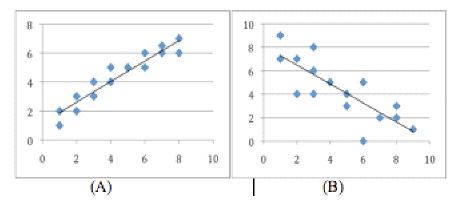
A. Graph A
B. Graph B
C. Both graphs indicate a negative correlation.
D. Both graphs indicate a positive correlation.
Answer: B
You might also like to view...
A psychologist who is asked to assess patients' lethality is being asked to find out ____
a. the probability that they will choose to end their lives b. whether they will survive their suicidal actions c. whether other people will copy their actions d. which method they are like to choose when attempting suicide
A "scalloped" response pattern is typical of which type of reinforcement schedule?
a. fixed-ratio b. fixed-interval c. variable-ratio d. variable-interval e. continuous
To train an animal to make some response, a psychologist decides to use the procedure known as shaping. This means that the psychologist will
A) force the animal into the necessary position to make the response. B) deprive the animal of food and water until it makes the response. C) display the correct response and let the animal imitate. D) start by reinforcing the animal for a simpler response.
In clinical diagnosis, the goal is to:
a. match the individual's symptoms to a particular mental disorder b. determine the cause(s) of a mental disorder c. evaluate the effectiveness of a particular therapy d. collect information about the person