Draw the graph of the line that contains the specified point and has the specified slope, m.(6, 0) , m = 
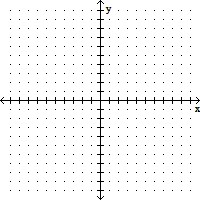
A. 
B. 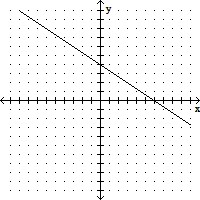
C. 
D. 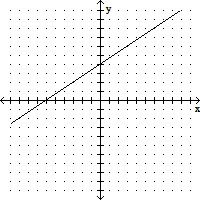
Answer: C
You might also like to view...
Use the two steps for solving a linear programming problem to solve the problem.Suppose an animal feed to be mixed from soybean meal and oats must contain at least 100 lb of protein, 20 lb of fat, and 9 lb of mineral ash. Each 100-lb sack of soybean meal costs $20 and contains 50 lb of protein, 10 lb of fat, and 8 lb of mineral ash. Each 100-lb sack of oats costs $10 and contains 20 lb of protein, 5 lb of fat, and 1 lb of mineral ash. How many sacks of each should be used to satisfy the minimum requirements at minimum cost?
A.  sacks of soybeans and
  sacks of oats
B.  sacks of soybeans and
  sacks of oats
C.
| 2 sacks of soybeans and 0 sacks of oats |
D. 0 sacks of soybeans and 2 sacks of oats
Find an upper bound for the magnitude |E| of the error in the linear approximation L to f at the given point over the given region. at (1, 1, 1)R: |x - 1| ? 0.1, |y - 1| ? 0.1, |z - 1| ? 0.1
A. |E| ? 0.0225 B. |E| ? 0.027 C. |E| ? 0.0337 D. |E| ? 0.0253
Determine any local or absolute extrema as indicated.Use the graph of f to estimate the absolute extrema.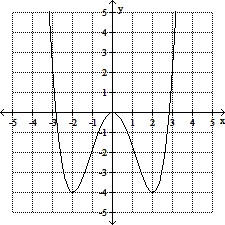
A. No absolute maximum; absolute minimum: -4 B. Absolute maximum: ?; absolute minima: -2 and 2 C. Absolute maximum: ?; absolute minimum: -4 D. Absolute maximum: 0; absolute minima: -2 and 2
Graph.x + 3 = 0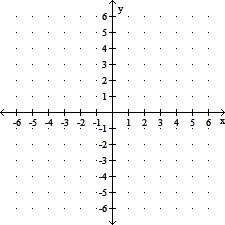
A. 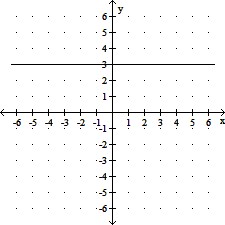
B. 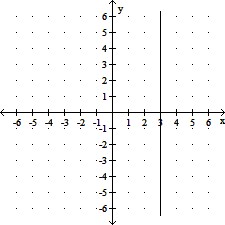
C. 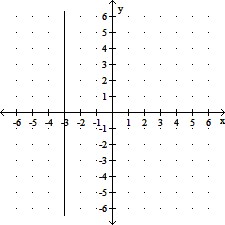
D. 