Use a graphing calculator to plot the data and find the quadratic function of best fit.An engineer collects data showing the speed s of a given car model and its average miles per gallon M. Use a graphing calculator to plot the scatter diagram. What is the quadratic function of best fit?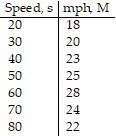
A. M(s) = 0.063x2 + 0.720x + 5.142
B. M(s) = -0.0063x2 + 0.720x + 5.142
C. M(s) = -6.309x2 + 0.720x + 5.142
D. M(s) = -0.631x2 + 0.720x + 5.142
Answer: B
You might also like to view...
Graph the linear inequality.3x + 4y ? 12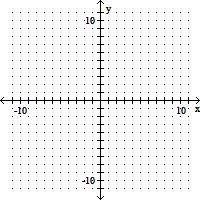
A. 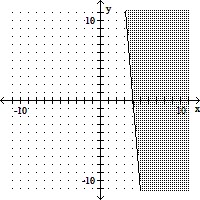
B. 
C. 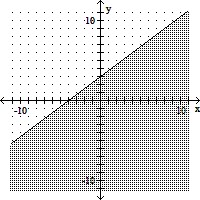
D. 
Plot the ordered pair. State in which quadrant or on which axis the point lies.(-2, -1)
A. quadrant III
B. quadrant II
C. quadrant III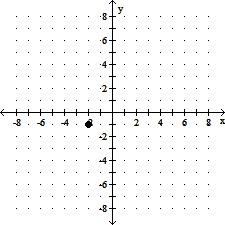
D. quadrant IV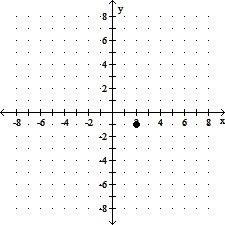
Factor completely. If the polynomial is prime, say so.12wx - 6wy - 2xz + yz
A. (6wz)(2x - y) B. (6w - z)(2x - y) C. (6w + z)(2x + y) D. (6 - z)(2wx - y)
Fill in each blank with the appropriate response.The graph of y = -5(x + 2)2 - 8 can be obtained from the graph of y = x2 by shifting horizontally ___ units to the ______ , vertically stretching by a factor of  reflecting across the __-axis, and shifting vertically ___ units in the _______ direction.
A. 2; right; 5; x; 8; downward B. 2; right; 5; x; 8; upward C. 2; left; 8; x; 5; downward D. 2; left; 5; x; 8; downward