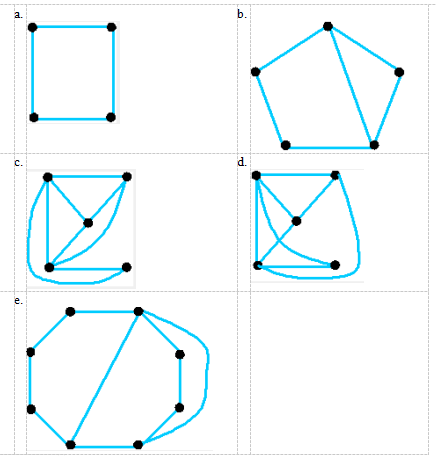
Find a graph that shows that the given graph is planar. 
 answer.png)
You might also like to view...
Solve the problem.According to a country's census, the population (to the nearest million) was 251 in Year 0 and 299 in Year 10. The projected population for Year 50 is 442. To construct a logistic model, both the growth and carrying capacity must be estimated. (a) Estimate r by assuming that t = 0 corresponds to Year 0 and that the population between Year 0 and Year 10 is exponential; that is, the population is given by  Round the value of r to four decimal places, if necessary.(b) Write the solution to the logistic equation using the estimated value of r and use the projected value P(50) = 442 million to find an estimation for the value of the carrying capacity K. Round to
the nearest million. A. (a) r = -1.0175 (b) K = 292 million B. (a) r = -0.0175 (b) K = 192 million C. (a) r = 0.0175 (b) K = 969 million D. (a) r = 1.0175 (b) K = 1,069 million
Find the vertical asymptotes of the rational function.g(x) = 
A. x = 9, x = -11 B. x = 0, x = 9 C. x = -3, x = 3 D. x = 0, x = -3, x = 3
Simplify the expression. Write the result using positive exponents only.
A. x3
B. 
C. 
D. 
Find the greatest common factor, GCF, of the expressions.x3, x4, x5
A. x3 B. x5 C. x D. x12