The graph of the function f follows. Choose the graph of 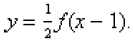

You might also like to view...
Write the best-fit linear model for the data.Ten students in a graduate program were randomly selected. Their grade point averages (GPAs) when they entered the program were between 3.5 and 4.0. The following data were obtained regarding their GPAs on entering the program versus their current GPAs. Find a linear function that approximates a student's current GPA as a function of his or her entering GPA.Entering GPACurrent GPA 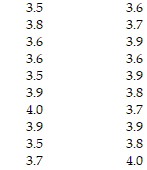
A. y = 3.67 + 0.0313x B. y = 2.51 + 0.329x C. y = 5.81 + 0.497x D. y = 4.91 + 0.0212x
A plane has normal vector n and passes through the point P. Find an equation for the plane.  figure 1.png)
What will be an ideal response?
Use the table to find the following derivative. Find Dx(f[g(x)]) at x = 1.
A. -4 B. -1 C. 8 D. 10
Add. Do not use a number line except as a check.-7 + 6
A. 13 B. -1 C. 1 D. -13