Use a graphing calculator to plot the data and find the quadratic function of best fit.A rock is dropped from a tall building and its distance (in feet) below the point of release is recorded as accurately as possible at various times after the moment of release. The results are shown in the table. Find the regression equation of the best model. 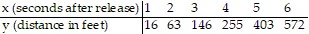
A. y = 13.0 e0.686x
B. y = - 148.4 + 112x
C. y = -74.9 + 290 lnx
D. y = 15.95x2
Answer: D
You might also like to view...
The following double-bar graph illustrates the revenue for a company for the four quarters of the year for two different years. Use the graph to answer the question.  What was the difference in revenue between the fourth quarter of 2009 and the fourth quarter of 2010?
A. $5 million B. $3 million C. $15 million D. $1 million
A formula is given, along with values for all but one of the variables in the formula. Find the value of the variable that is not given.A = ?r2 for r = 6, ? = 3.14
A. A = 9.14 B. A = 18.84 C. A = 59.16 D. A = 113.04
Write in words, as on a check.$17.68
A. Seventeen and  dollars
B. Seventy and  dollars
C. Seventeen and  dollars
D. One thousand seven hundred sixty-eight and  dollars
Provide the proper response. Show all fractions in simplest form.Write a fraction to represent the shaded portion of the figure.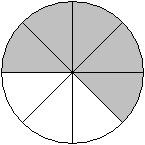
A. 
B. 
C. 
D. 