A new chocolate company is estimating how many candy bars per week college students will consume of their line of products. The graph shows the probable number of candy bars students (age 18-22) will consume from year 0 to year 10. B(x) gives the number of candy bars for boys, G(x) gives the number of candy bars for girls, and T(x) gives the total number for both groups. Use the graph to answer the question.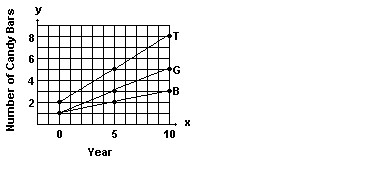 Estimate B(7) and G(7) and use your estimates to estimate T(7).
A. 3.5; 4.2; 7.7
B. 2.3; 4.0; 6.3
C. 2.5; 4.0; 6.5
D. 2.2; 4.3; 6.5
Answer: D
Mathematics
You might also like to view...
Classify the function as even, odd, or neither.f(x) = 6x3 + 3
A. Even B. Odd C. Neither
Mathematics
Evaluate the exponential function at the specified value of x.f(x) = 3x , x = 4
A. 
B. 
C. 12
D. 81
Mathematics
Evaluate the polynomial.-2x5 + 4x4 + 3x3 - x2for x = 2
A. 49 B. 16 C. 15 D. 20
Mathematics
Determine which of the two numbers is larger. Do not use a calculator.?1.6 or ?2.8
A. ?1.6 B. ?2.8 C. Both have the same value. D. Cannot be determined
Mathematics