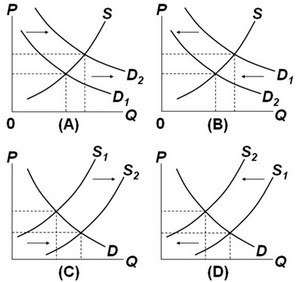
 Which of the above diagrams illustrate(s) the effect of a decline in the price of personal computers on the market for computer software?
A. A only
B. B only
C. A and D
D. D only
Answer: A
You might also like to view...
The major economic cost of growth is:
A. investment in stocks and bonds. B. higher interest rates. C. consumption sacrificed for capital formation. D. higher inflation rates.
We would expect
A. the demand for Coca-Cola to be relatively more elastic than the demand for soft drinks in general. B. no relationship between the price elasticity of demand for Coca-Cola and the price elasticity of demand for soft drinks in general. C. the demand for Coca-Cola to be relatively more inelastic than the demand for soft drinks in general. D. none of these to hold true.
In the above table, the total fixed cost is
A) $0. B) $20. C) $30. D) $50.
If the number of close substitutes of a good increases, _____
a. the elasticity of demand for the good decreases b. the elasticity of demand for the good increases c. the elasticity of demand for the good becomes zero d. the elasticity of demand for the good remains unaffected