YearCPI2010952011100201210520131042014106According to the table shown, what happened to the cost of living from 2013 to 2014? The cost of living:
A. increased; consumers became better off than they would have been if the price level had not changed.
B. increased; consumers became worse off than they would have been if the price level had not changed.
C. decreased; consumers became better off than they would have been if the price level had not changed.
D. decreased; consumers became worse off than they would have been if the price level had not changed.
Answer: B
You might also like to view...
Assume that when the price of good X is $7, quantity demanded is 25. When price is increased to $9, quantity demanded falls to 20. Based on this information, over the range in question demand is elastic
Indicate whether the statement is true or false
Sulfur Dioxide Discharged (Tons)Firm AFirm B10$10,000$12,000911,00017,000813,00022,000716,00026,000620,00033,000Table 16.4Table 16.4 shows the production cost for two utilities at different levels of sulfur dioxide emissions. Assume that the government issued 8 marketable pollution permits to each firm. If Firm A contemplates selling a second permit to Firm B, what is Firm A's willingness to accept?
A. $2,000 B. $3,000 C. $4,000 D. $5,000
A monopolist faces a demand curve that
A) is perfectly horizontal at the market price. B) is below the marginal revenue curve. C) is downward sloping. D) coincides with the industry supply.
Referring to Figure 1.5, the opportunity cost of producing the third unit of pizza is 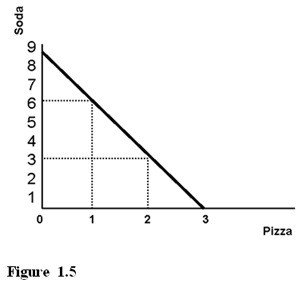
A. one unit of soda. B. six units of soda. C. three units of soda.