Refer to Figure 7.6. Which graph represents constant returns to scale?
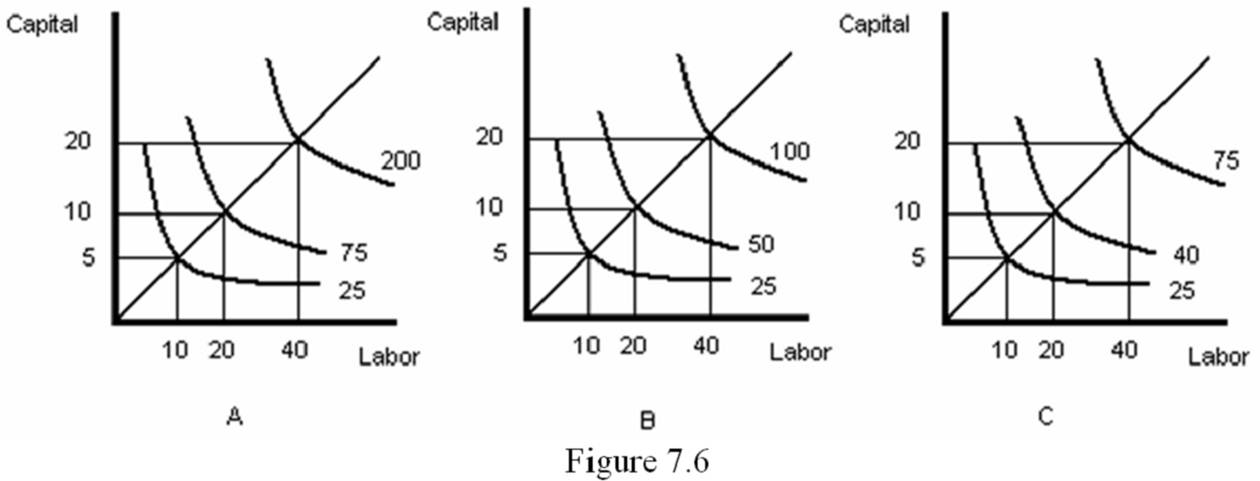
A. A
B. B
C. C
D. Both graph A and graph C
B. B
You might also like to view...
A shift of the supply curve of oil raises the price from $60 a barrel to $75 a barrel and reduces the quantity demanded from 40 million to 20 million barrels a day. You can conclude that the
A) demand for oil is elastic. B) demand for oil is inelastic. C) supply of oil is elastic. D) supply of oil is inelastic.
If nominal money supply grows 3% and real money demand grows 8%, the inflation rate is
A) -5%. B) 8/3%. C) 5%. D) 11%.
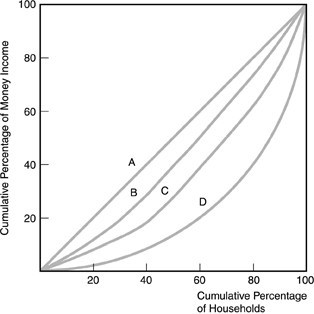 Refer to the above figure. Perfect income equality is shown by
A. curve A. B. the horizontal axis. C. the vertical axis. D. curve D.
A price setter is a firm that:
A. attempts but fails to be perfectly competitive. B. faces perfectly inelastic demand. C. has the ability to set price at any level it wishes. D. has some degree of control over its price.