The circle graph shows the number of times a group of survey respondents watched the news in the past week. Use the chart to answer the question. 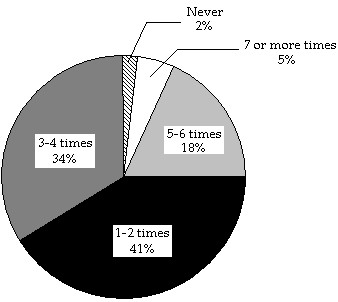 If the number of respondents in the study was approximately 44,397, estimate how many stated that they watched the news 5-6 times in the last week.
A. 8000 respondents
B. 6000 respondents
C. 10,000 respondents
D. 12,000 respondents
Answer: A
Mathematics
You might also like to view...
Find the volume of the solid generated by revolving the region bounded by the given lines and curves about the  . y =
. y =  , y = 0, 0 ? x ?
A. 2?
B. 6?
C.  ?
?
D. 3?
Mathematics
Find the domain. Write interval notation for the answer.f(x) = 
A. (-?, 0) ? (3, ?) B. (-?, -3) ? (-3, 0) ? (0, ?) C. (-?, -3) ? (-3, 1) ? (1, ?) D. (-?, -3) ? (0, ?)
Mathematics
Solve the equation.6(x + 4) = 8(x + 2.8)
A. 1.6 B. 3.2 C. 0.8 D. 23.2
Mathematics
Find the distance on the number line between the pair of numbers.3, -2
A. -5 B. -1 C. 5 D. 1
Mathematics