This graph demonstrates the domestic demand and supply for a good, as well as the world price for that good.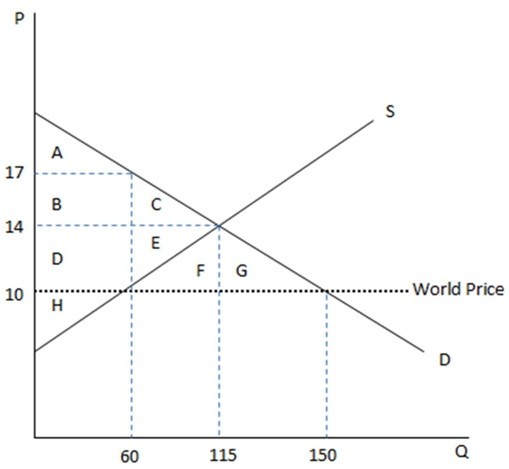 According to the graph shown, if this economy were to open to trade, domestic producers would have to cut:
A. prices by $3.
B. production by 55 units.
C. production by 90 units.
D. prices by $7.
Answer: B
You might also like to view...
If the Fed buys government securities from the non-bank public, then
A) reserves at banks decrease. B) deposits at banks increase and banks' reserves increase. C) deposits at banks increase and banks' reserves decrease. D) loans at banks decrease. E) deposits at banks decrease and banks' reserves increase.
From one year to the next, a country's output rose from 4000 to 4500, its capital stock rose from 10,000 to 12,000, and its labor force declined from 2000 to 1750. Suppose aK = 0.3 and aN= 0.7
(a) How much did capital contribute to economic growth over the year? (b) How much did labor contribute to economic growth over the year? (c) How much did productivity contribute to economic growth over the year?
Gladys agrees to lend Kay $1,000 for one year at a nominal rate of interest of 5 percent. At the end of the year prices have actually risen by 7 percent
a. Gladys earns extra real income. b. Kay loses extra real income. c. Kay receives extra real income. d. Neither party gains or loses if the loan is repaid.
In the early 2000s, some argued that the Indian government impeded foreign investment with tariffs, investment caps, and tons of red tape. In terms of promoting or retarding economic growth, such policies:
A. increase growth because they keep people producing for the local market. B. decrease growth because they slow the growth of capital. C. increase growth because they stop exploitation by foreigners. D. decrease growth because they cause inflation.