Make a bar graph using the given frequencies.The frequency distribution indicates the height in feet of persons in a group of 135 people. 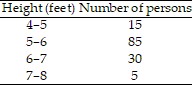

A. 
B. 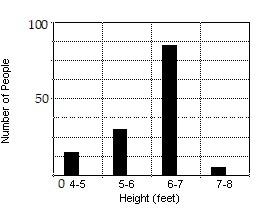
C. 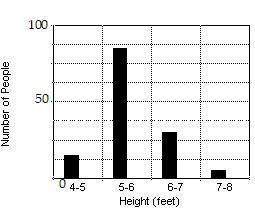
D. 
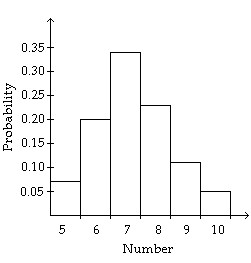
Answer: C
Mathematics
You might also like to view...
Solve. Then graph the solution.(3 - 5x)2 ? -9![]()
A.  ?
? 
![]()
B. (-?, ?)![]()
C. ?![]()
D. 
![]()
Mathematics
Solve. Round to the nearest hundredth if necessary.76 is 38% of what number?
A. 50 B. 2000 C. 0.5 D. 200
Mathematics
Perform the indicated operations and simplify. +
+ 
A. 
B. 
C. 
D. 
Mathematics
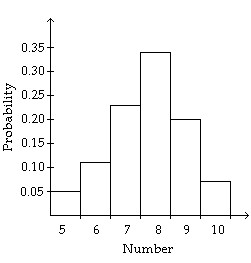
Give the probability distribution and sketch the histogram.A class of 44 students took a 10-point quiz. The frequency of scores is given in the table.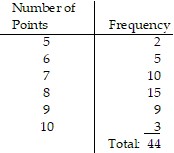
A. 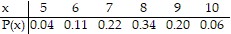

B. 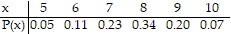
C. 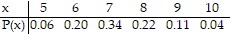

D. 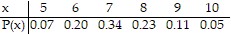
Mathematics