Solve the problem.The population of a formerly endangered mouse is now on the rise. The population, N, over the last 8 years can be represented with the following graph: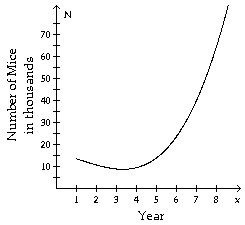 When was the mice population the lowest?
A. At the beginning of the 8 year period.
B. Just before the end of the second year.
C. During the fifth year.
D. Just after the end of the third year.
Answer: D
Mathematics
You might also like to view...
Find the equation of the parabola whose vertex and focus are shown.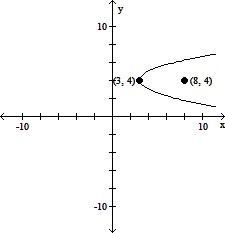
A. (y - 4)2 = -20(x - 3) B. (x - 4)2 = -20(y - 3) C. (y - 4)2 = 20(x - 3) D. (x - 4)2 = 20(y - 3)
Mathematics
Give the number of rows in the truth table for the compound statement.p ? (~q ? r)
A. 9 B. 6 C. 8 D. 3
Mathematics
Evaluate the function.For g(x) =  , find g(7).
A. 2
B. 
C. 3
D. 
Mathematics
Find the LCM.x2 - 2x - 15 and 2x + 6
A. 2(x + 5)(x + 3) B. 2(x - 5)(x - 3) C. 2(x + 5)(x - 3) D. 2(x - 5)(x + 3)
Mathematics