Solve the equation  . (Find all real and complex solutions.)
A. ![]()
B. ![]()
C. ![]()
D. ![]()
E. ![]()
Answer: A
You might also like to view...
Consider a function  . If the graph of
  is below the horizontal axis, what can be said about the graph of f?
?
is below the horizontal axis, what can be said about the graph of f?
?
A. The graph of f is above the horizontal axis. B. The graph of f is below the horizontal axis. C. The graph of f is decreasing. D. The graph of f is a straight line.
Simplify.
A. 
B. 
C. 
D. - 
Graph the function by starting with the graph of the basic function and then using the techniques of shifting, compressing, stretching, and/or reflecting.f(x) = 

A. 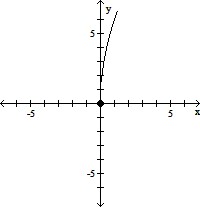
B. 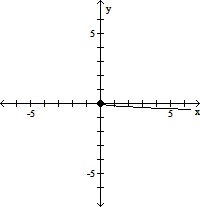
C. 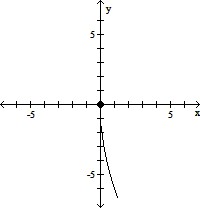
D. 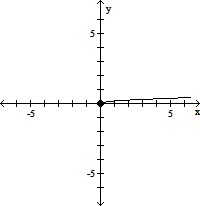
Analyze the graph of the given function f as follows:(a) Determine the end behavior: find the power function that the graph of f resembles for large values of |x|.(b) Find the x- and y-intercepts of the graph.(c) Determine whether the graph crosses or touches the x-axis at each x-intercept.(d) Graph f using a graphing utility.(e) Use the graph to determine the local maxima and local minima, if any exist. Round turning points to two decimal places.(f) Use the information obtained in (a) - (e) to draw a complete graph of f by hand. Label all intercepts and turning points.(g) Find the domain of f. Use the graph to find the range of f.(h) Use the graph to determine where f is increasing and where f is decreasing.f(x) = x2(x + 2)
What will be an ideal response?