Aggregate demand and supply curves have been widely used to analyze the performance of the macroeconomy. Figure 5-3 shows four diagrams that represent different changes in the macroeconomy. Choose the diagram that best represents the situations described in the following questions.Figure 5-3
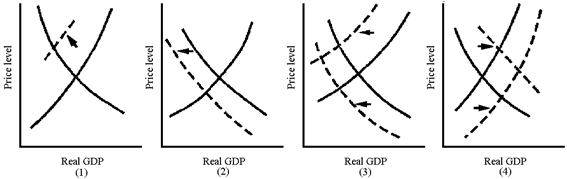
Which graph in Figure 5-3 best represents the economic conditions of the American economy in 2001?
A. 1
B. 2
C. 3
D. 4
Answer: B
You might also like to view...
If the price level falls, the
A) quantity of money demanded decreases. B) quantity of money demanded increases. C) demand for money does not change and the quantity of money demanded does not change. D) demand for money increases. E) demand for money decreases.
After an excise tax is imposed on a good or service,
a. the equilibrium price and quantity are unchanged b. firms must charge a higher price for any particular quantity c. firms must charge a lower price for any particular quantity d. the equilibrium price and quantity will both increase e. the equilibrium price and quantity will both decrease
If the Fed sells bonds in an open market operation, which of the following is most likely to occur?
a. The equilibrium level of GDP decreases b. The money supply increases c. The interest rate falls d. The aggregate expenditure line shifts upward e. The open market operation is said to be expansionary.
Jane has just sent a gift that was made in the U.S. to her relatives in Italy. As far as the balance of payments is concerned this gift will
A. be part of the current account as a unilateral transfer. B. be considered an export since it has left the U.S. C. be part of the capital account since the gift is a physical item. D. have no influence on the balance of payments since it was made in the U.S.