Based on the figure below. Starting from long-run equilibrium at point C, a tax cut that increases aggregate demand from AD to AD1 will lead to a short-run equilibrium at point ________ and eventually to a long-run equilibrium at point ________, if left to self-correcting tendencies. 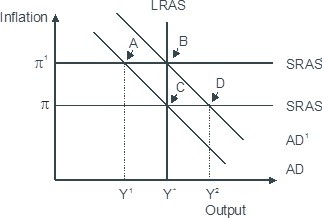
A. D; C
B. B; C
C. B; A
D. D; B
Answer: D
You might also like to view...
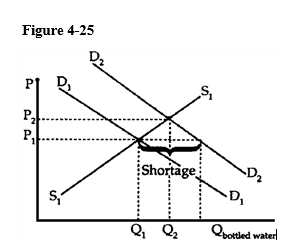 Producers were accused of price gouging as the price of bottled water soared after Hurricane Andrew. Consumers clamored for price controls to keep bottled water at pre-Andrew levels. Use supply and demand analysis to graphically show the effect of setting a price ceiling on bottled water after Hurricane Andrew at the pre-hurricane equilibrium price. Use your graph to assist in explaining the likely unintended effects of such a price control. Be sure that your graph is completely and correctly labeled.
What will be an ideal response?
If interest rates rise, what will happen to the nation's exchange rate?
What will be an ideal response?
Figure 10-13
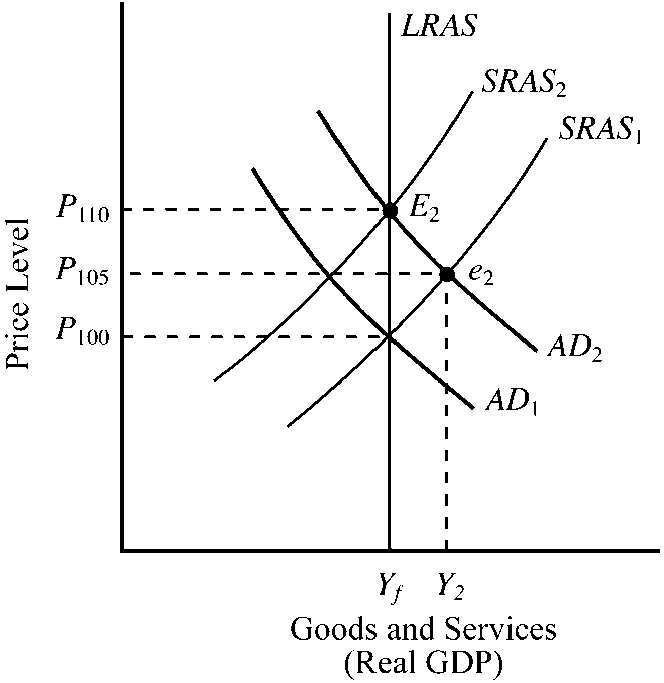
In , which of the following would most likely cause the movement from point e2 to point E2?
a.
higher wages and resource prices
b.
lower interest rates
c.
an increase in aggregate demand
d.
a technological advance
All of the following is likely to increase the supply of U.S. dollars in the forex market except?
A. If U.S. consumers prefer foreign goods to U.S. goods B. If investors' confidence in US investments increases. C. If investors' confidence in foreign economies increases D. If U.S. interest rates are low relative to foreign interest rates