Refer to the graph shown.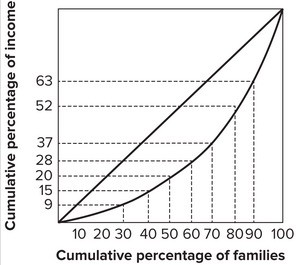 The poorest 30 percent of the families earn:
A. 9 percent of the income.
B. 15 percent of the income.
C. 2 percent of the income.
D. 5 percent of the income.
Answer: A
You might also like to view...
Refer to Figure 1A.1. Assume that the graph in this figure represents the demand and supply curves for women's clothing. An increase in the wage rate for seamstresses would be represented by a shift from
A) Demand 1 to Demand 2. B) Demand 2 to Demand 1. C) Supply 1 to Supply 2. D) Supply 2 to Supply 1.
In a market system, ________ provide signals about whether resources are relatively scarce or abundant.
A. scientists B. buyers alone C. government officials D. prices
An example of a transfer payment is
A) a teacher's paycheck. B) a paycheck for a member of the National Guard. C) a welfare payment. D) a purchase of a new bridge in Alaska.
When two goods are unrelated,
A. their cross price elasticity of demand will be 0. B. their cross price elasticity of demand will be infinity. C. their cross price elasticity of demand will be negative. D. their cross price elasticity of demand will be positive.