The following graph shows the production possibilities curve for the economy with only two members, Silvia and Art. Silvia can produce either 50 pounds of beef or 2 computers per week, and Art can produce 100 pounds of beef or 1 computer per week. Both of them work 40 weeks per year.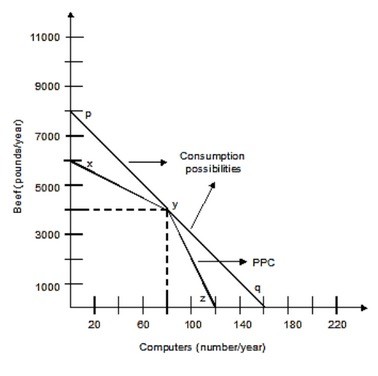 Art's opportunity cost of producing one pound of beef is ________ computer(s).
A. 100
B. 1/100
C. 1/50
D. 50
Answer: B
You might also like to view...
Comparing M1 and M2 we know that
A) M1 is larger because it contains currency. B) M2 is approximately equal to M1. C) M2 is larger because it contains M1 and other assets. D) M2 is larger because it contains more liquid assets than does M1.
An upward-sloping supply curve of Korean won in terms of Canadian dollars indicates that:
a. the higher the dollar price of Korean won, the more won will be demanded. b. the higher the dollar price of Korean won, the fewer won will be supplied. c. the lower the dollar price of Korean won, the more won will be demanded. d. the lower the dollar price of Korean won, the fewer won will be supplied. e. the Korean economy is stronger than the Canadian economy.
Once the supply curve for a product or service is drawn, it
a. remains stable over time. b. can shift either rightward or leftward. c. is possible to move along the curve, but the curve will not shift. d. tends to become steeper over time.
Which agreement was signed in 1944 with the purpose of creating a new international payment system?
A. Bretton Woods B. Philadelphia Accord C. Camp David D. Tokyo Protocol