Where can equilibrium GDP be found on a graph?
a. Where the consumption function crosses the 45-degree line
b. Where the 45-degree line crosses the investment function
c. Where the aggregate expenditure function crosses the 45-degree line
d. Where total output is equal to the unplanned inventory change
e. Where the next exports function crosses the 45-degree line
C
You might also like to view...
According to the Law of Supply,
a. price and quantity supplied are positively related, c.p. b. firms produce less output as the price of the product rises, ceteris paribus c. marginal cost rises as the firm contracts production d. there is an inverse relationship between output and price, holding all else constant
The U.S. fiscal policy implemented in 2008 was an attempt to
A) give billions of dollars to businesses and low- and middle-income Americans in order to stimulate business investment and consumption expenditure, and thereby increasing AD. B) give billions of dollars to businesses and low- and middle-income Americans in order to stimulate business investment and consumption expenditure, and thereby increasing SAS. C) decrease interest rates in order to stimulate business investment and consumption expenditure, and thereby increasing AD. D) decrease the exchange rate in order to boost net exports, and thereby increasing AD.
Suppose that the federal budget is balanced when GDP is at potential GDP. If equilibrium GDP falls below potential,
A) this will result in a current budget deficit. B) government transfer payments will be rising and tax receipts will be falling. C) the cyclically adjusted budget will be balanced. D) All of the above are correct.
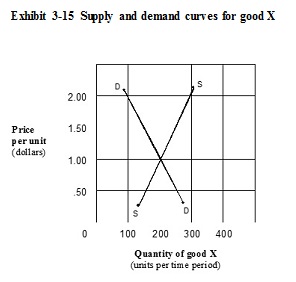 ?
In the market shown in Exhibit 3-15, the equilibrium price and quantity of good X are:
?
In the market shown in Exhibit 3-15, the equilibrium price and quantity of good X are:
A. $0.50, 250. B. $2.00, 300. C. $2.00, 100. D. $1.00, 200.