Plot and interpret the appropriate scatter diagram.The table gives the times spent watching TV and the grades of several students.  Which scatter diagram describes the data and the relationship, if any?
A. 
More hours spent watching TV may increase grades.
B. 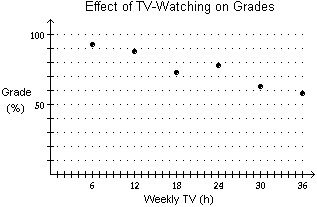
More hours spent watching TV may reduce grades.
C. 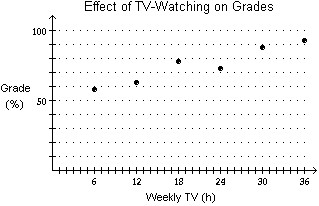
More hours spent watching TV may reduce grades.
D. none of these
Answer: B
Mathematics
You might also like to view...
Solve the problem.Find the magnitude of the torque in foot-pounds at point P for the following lever:
 = 7 in. and
  = 10 lb
A. -3502.60 ft-lb B. -850.63 ft-lb C. 3975.42 ft-lb D. 70 ft-lb
Mathematics
Write the following as a base-ten numeral.3 ? 10 + 3
A. 33 B. 60 C. 303 D. None of these
Mathematics
Simplify.|15|
A. 0 B. 15 C. -15 D. 30
Mathematics
The given pattern continues. Write down the nth term of the sequence suggested by the pattern.0, 2, 6, 12, 20, ...
A. an = 2n - 2 B. an = n2 - n C. an = 4n - 6 D. an = 2n-1 - 1
Mathematics