In the diagram below, the profit maximizing price level is 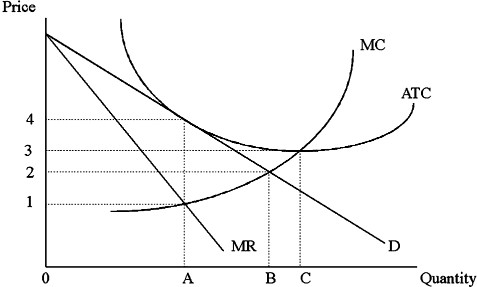
A. 3.
B. 4.
C. 1.
D. 2.
Answer: B
You might also like to view...
Of all the points on the production possibilities curve, only one point represents an efficient point
a. True b. False Indicate whether the statement is true or false
Over the two decades leading up the 2008 crisis, __________ interest rates meant that consumers could take on _____ debt without significantly increasing the amount of debt service they had to pay.
A. falling; more B. rising; more C. falling; less D. rising; less
Which of the following would be most likely to improve the standard of living of a less-developed country?
a. development of strong labor unions b. more foreign investment, attracted by the expectation of economic and political stability c. adoption of trade barriers (higher tariffs and quotas) d. widespread use of price controls to allocate goods and resources
Refer to the information provided in Figure 20.1 below to answer the question(s) that follow.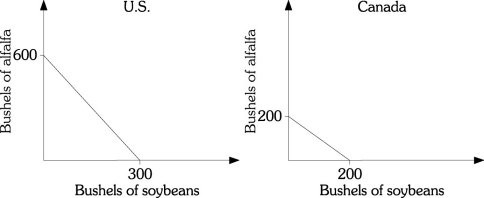 Figure 20.1Refer to Figure 20.1. Which of the following statements is true?
A. The United States has an absolute advantage in the production of soybeans and alfalfa, but a comparative advantage only in the production of soybeans. B. The United States has both an absolute advantage and a comparative advantage in the production of soybeans and alfalfa. C. The United States has a comparative advantage in the production of both soybeans and alfalfa, but an absolute advantage only in the production of soybeans. D. The United States has an absolute advantage in the production of soybeans and alfalfa, but a comparative advantage only in the production of alfalfa.