Refer to the information provided in Figure 23.2 below to answer the question(s) that follow.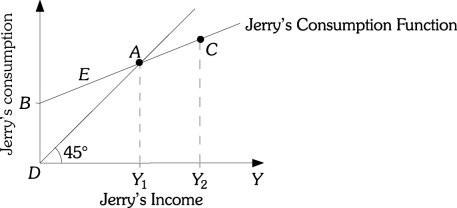 Figure 23.2Refer to Figure 23.2. Negative saving is represented by the area
A. DBCY2.
B. DBAY1.
C. ACY2Y1.
D. DBAD.
Answer: D
You might also like to view...
If the money supply grows at 5% and real GDP grows at 6%, the quantity theory predicts the inflation rate will be
A) -1%. B) 1%. C) 1.2%. D) 11%.
Two friends, Diane and Sam, own and run a bar. Diane tends bar on Monday, Wednesday, and Friday and receives a wage in addition to tips. Sam tends bar on Tuesday, Thursday, and Saturday and receives only tips. Which of the following represents an implicit cost of operating the bar?
a. Diane's wage b. Sam's time c. Diane's tips d. Sam's tips e. both Diane's and Sam's tips
Milk costs $2 and the last unit provides $4 in marginal utility. Cheese costs $4 and the last unit provides $2 in marginal utility. Is this an efficient allocation of resources? If so, why? If not, why not?
What will be an ideal response?
Productivity growth is closely linked to the average level of:
a. age. b. education. c. technology. d. wages.