Refer to the below graph, where TP = total product and L = labor input. The marginal product of labor (MP):
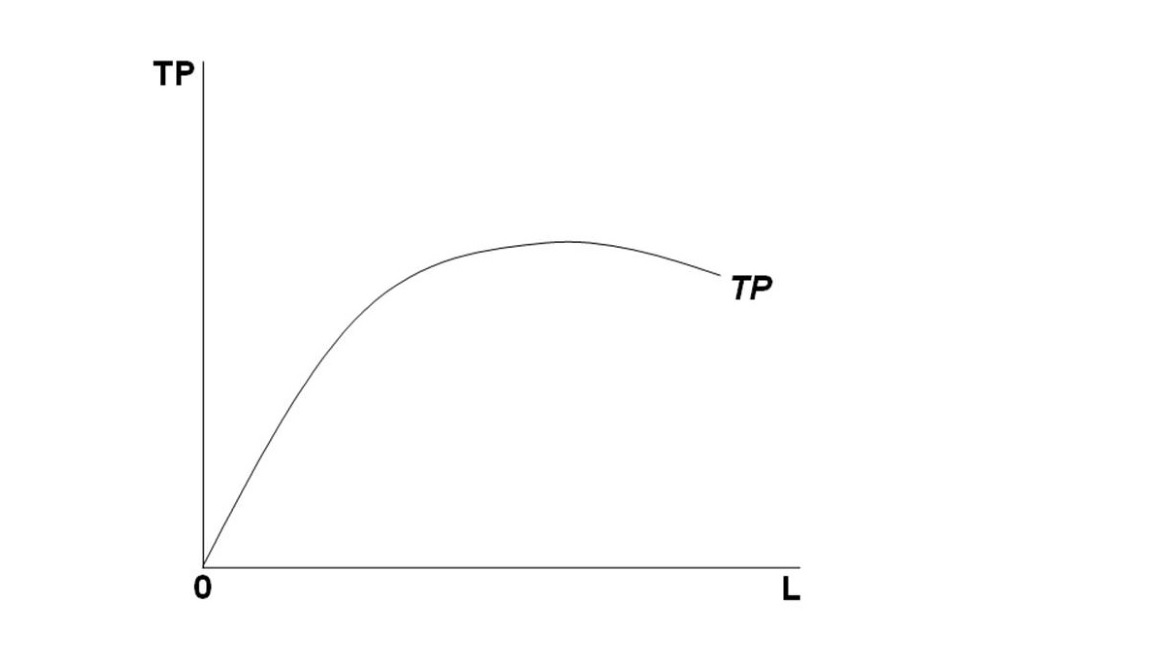
A. Is constant at all levels of L
B. Increases at an increasing rate as L increases
C. Decreases as the labor input L increases
D. Increases at a decreasing rate as L increases
C. Decreases as the labor input L increases
You might also like to view...
The cost of producing aspirin increases simultaneously as doctors find that one aspirin per day reduces the risk of heart attacks. The supply of aspirin ________ and the demand for aspirin ________ so that the equilibrium price of aspirin ________
A) increases; increases; rises B) decreases; increases; rises C) increases; decreases; might rise, fall, or stay the same D) decreases; increases; might rise, fall, or stay the same
Refer to the information above. What is the value of the exponent for uneducated labor (L)?
A) 0.75 B) 0.40 C) 0.35 D) 0.15
Suppose that the total expenditures for a typical household in 2015 equaled $5,500 per month, while the cost of purchasing exactly the same items in 2017 was $6,875. If 2015 is the base year, the CPI for the year 2017 equals:
A. 1.20 B. 1.25 C. 1.00 D. 0.80
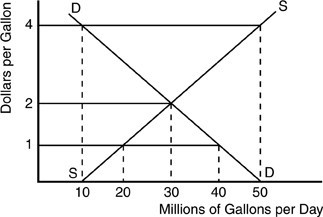 According to the above figure for a gasoline market, at a price of $1 per gallon of gasoline, there would be
A. a surplus of 50 million gallons. B. a shortage of 30 million gallons. C. a surplus of 30 million gallons. D. a shortage of 20 million gallons.