Refer to Figure 3-8. The graph in this figure illustrates an initial competitive equilibrium in the market for motorcycles at the intersection of D1 and S2 (point B)
If there is an increase in number of companies producing motorcycles and a decrease in income (assume motorcycles are a normal good), the equilibrium could move to which point?
A) A B) B C) C D) E
C
You might also like to view...
Increases in labor productivity from improved technology
a) increase the long run supply of labor b) reduce the demand for labor c) reduce real wages d) induce firms to substitute capital for labor e) have no long run effect on total hours worked
The owners of a corporation are
A) the employees of the firm. B) the shareholders. C) completely in control of the firm. D) taxed only once.
A patent provides legal protection for an invention for
A. 20 years. B. 9 years. C. 100 years. D. 5 years.
Refer to the information provided in Figure 8.3 below to answer the question(s) that follow. 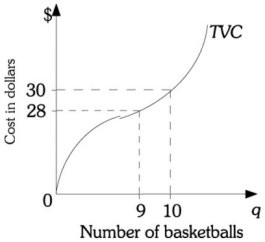 Figure 8.3
Refer to Figure 8.3. If the total fixed cost is $50, then average total cost of producing 10 basketballs is
Figure 8.3
Refer to Figure 8.3. If the total fixed cost is $50, then average total cost of producing 10 basketballs is
A. $3. B. $5. C. $8. D. $80.